Basic Mathematics
Number System LCM & HCF Percentage Ratio & Proportion Average Simple InterestBusiness Mathematics
Profit & Loss Compound Interest Partnership Discount Stocks & Shares BankingTime, Work & Motion
Time & Work Pipes & Cisterns Time, Speed & Distance Trains Boats & Streams RacesAdvanced Mathematics
Algebra Geometry Mensuration Trigonometry Logarithms & Indices Coordinate GeometryStatistics & Probability
Statistics Probability Permutation Combination Set Theory Data InterpretationData Interpretation Aptitude Questions & Formulas with answer
Ques 31 GATE 2014 Set-4
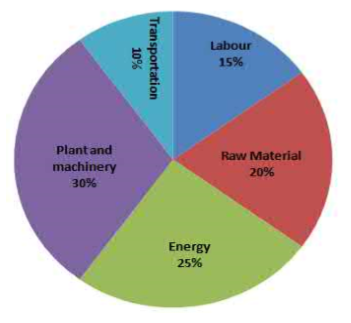
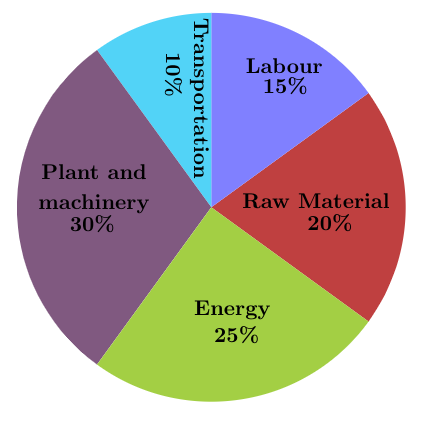
A firm producing air purifiers sold 200 units in 2012. The following pie chart presents the share of raw material, labour, energy, plant & machinery, and transportation costs in the total manufacturing cost of the firm in 2012. The expenditure on labour in 2012 is Rs. 4,50,000. In 2013, the raw material expenses increased by 30% and all other expenses increased by 20%. What is the percentage increase in total cost for the company in 2013?
(22) is the correct answer.
Ques 32 GATE 2014 SET-3
A firm producing air purifiers sold 200 units in 2012. The following pie chart presents the share of raw material, labour, energy, plant & machinery, and transportation costs in the total manufacturing cost of the firm in 2012. The expenditure on labour in 2012 is Rs. 4,50,000. In 2013, the raw material expenses increased by 30% and all other expenses increased by 20%. If the company registered a profit of Rs. 10 lakhs in 2012, at what price (in Rs.) was each air purifier sold?
(20000) is the correct answer.
Ques 33 GATE 2014 SET-3
The table below has question-wise data on the performance of students in an examination. The marks for each question are also listed. There is no negative or partial marking in the examination.
| Q No. | Marks | Not Attempted |
|---|---|---|
| 1 | 2 | 6 |
| 2 | 3 | 2 |
| 3 | 2 | 3 |
(c) is the correct answer.
Ques 34 GATE 2014 SET-3
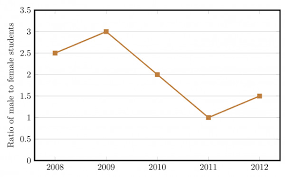
The ratio of male to female students in a college for five years is plotted in the following line graph. If the number of female students in 2011 and 2012 is equal, what is the ratio of male students in 2012 to male students in 2011?

(c) is the correct answer.
Ques 35 GATE 2014 SET-2
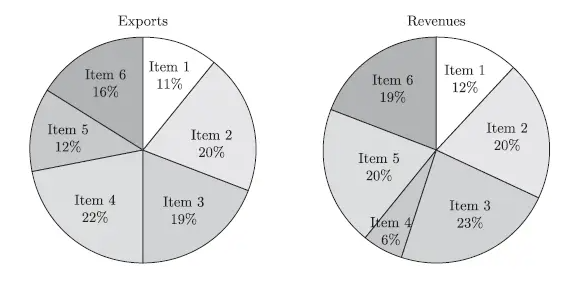
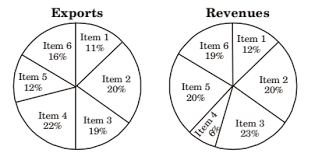
The total exports and revenues from the exports of a country are given in the two pie charts below. The pie chart for exports shows the quantity of each item as a percentage of the total quantity of exports. The pie chart for the revenues shows the percentage of the total revenue generated through export of each item. The total quantity of exports of all the items is 5 lakh tonnes and the total revenues are 250 crore rupees. What is the ratio of the revenue generated through export of Item 1 per kilogram to the revenue generated through export of Item 4 per kilogram?
(d) is the correct answer.
Ques 36 GATE 2014 SET-2
The total exports and revenues from the exports of a country are given in the two charts shown. The pie chart for exports shows the quantity of each item exported as a percentage of the total quantity of exports. The pie chart for the revenues shows the percentage of the total revenue generated through export of each item. The total quantity of exports of all the items is 500 thousand tonnes and the total revenues are 250 crore rupees. Which item among the following has generated the maximum revenue per kg?
(d) is the correct answer.
Ques 37 GATE 2014 SET-2
The ratio of male to female students in a college for five years is plotted in the following line graph. If the number of female students doubled in 2009, by what percent did the number of male students increase in 2009?
(140) is the correct answer.
Ques 38 GATE 2014 SET-2
The total exports and revenues from the exports of a country are given in the two charts shown below. The pie chart for exports shows the quantity of each item exported as a percentage of the total quantity of exports. The pie chart for the revenues shows the percentage of the total revenue generated through export of each item. The total quantity of exports of all the items is 500 thousand tonnes and the total revenues are 250 crore rupees.
Which item among the following has generated the maximum revenue per kg?
(item 5) is the correct answer.
Ques 39 GATE 2014 SET-1
The monthly rainfall chart based on 50 years of rainfall in Agra is shown in the following figure. Which of the following are true? (k percentile is the value such that k percent of the data fall below that value)
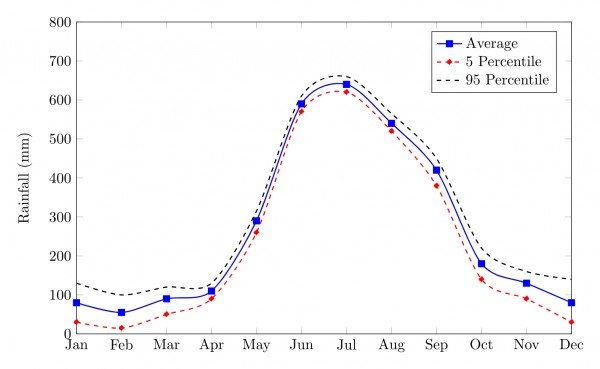
(i) On average, it rains more in July than in December.
(ii) Every year, the amount of rainfall in August is more than that in January.
(iii) July rainfall can be estimated with better confidence than February rainfall.
(iv) In August, there is at least 500 mm of rainfall.
(a) is the correct answer.
Ques 40 GATE 2014 SET-1
The exports and imports (in crores of Rs.) of a country from 2000 to 2007 are given in the bar chart. If the trade deficit is defined as excess of imports over exports, in which year is the trade deficit 1/5th of the exports?
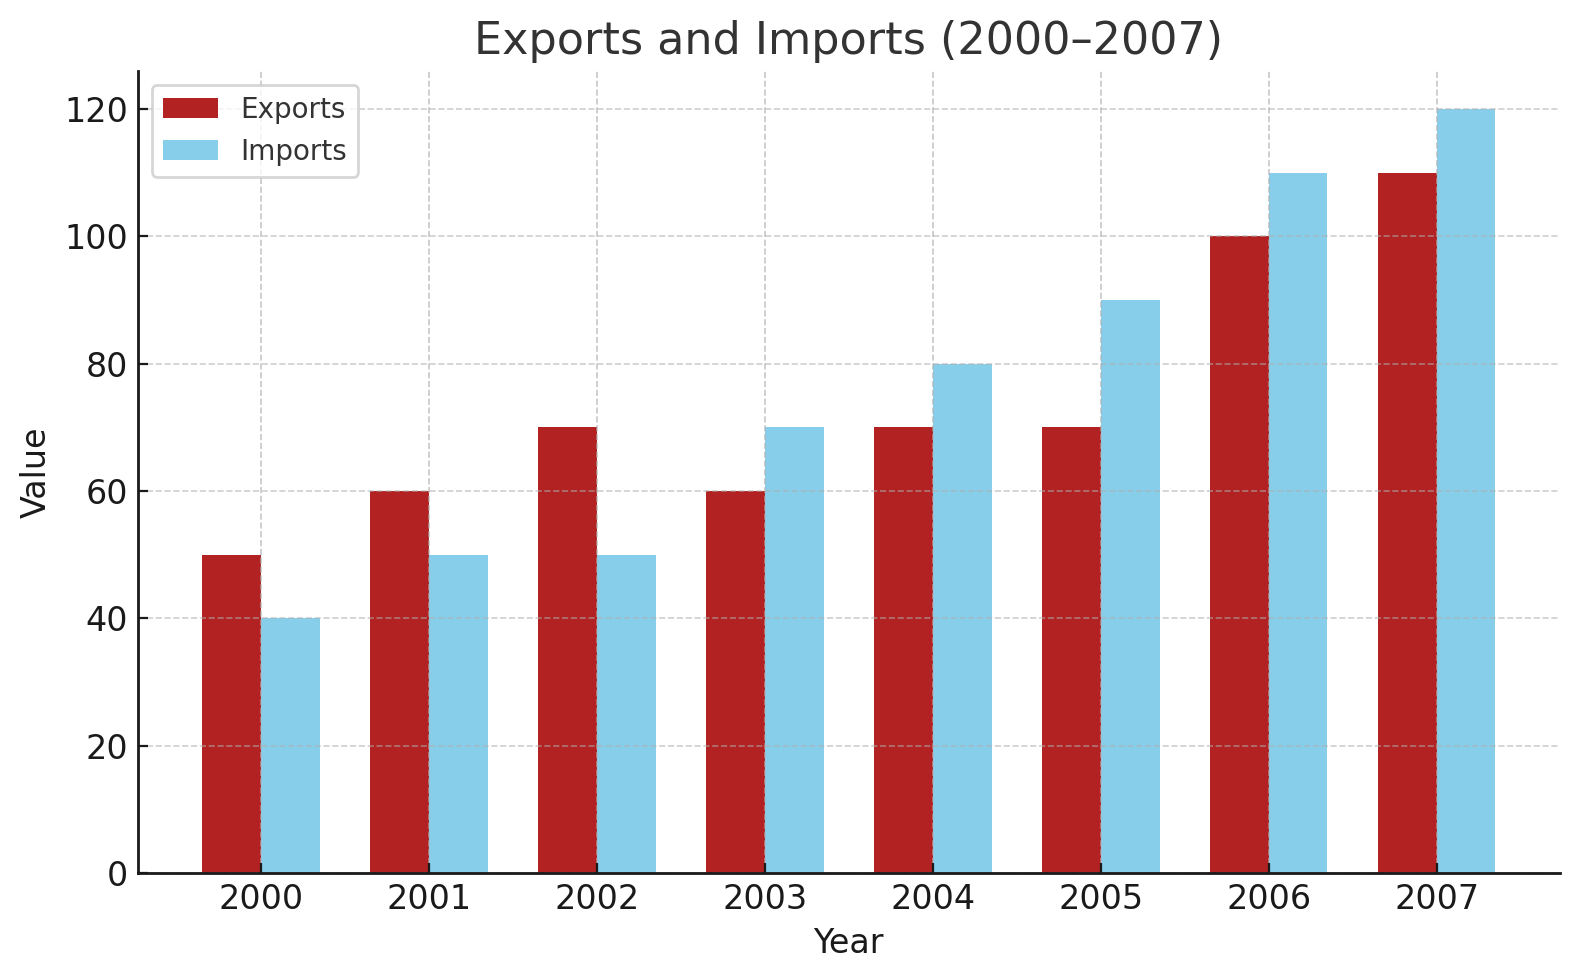
(d) is the correct answer.
Ques 41 GATE 2014 Set-1
The statistics of runs scored in a series by four batsmen are provided in the following table. Who is the most consistent batsman of these four?

(a) is the correct answer.
Ques 42 GATE 2014 Set-1
The exports and imports (in crores of Rs.) of a country from 2000 to 2007 are give are given in the following bar chart. If the trade deficit is defined as excess of imports over exports, then in which year is the trade deficit maximum?

(b) is the correct answer.
Ques 43 GATE 2014
The total exports and revenues from the exports of a country are given in the two pie charts below. The pie chart for exports shows the quantity of each item as a percentage of the total quantity of exports. The pie chart for the revenues shows the percentage of the total revenue generated through export of each item. The total quantity of exports of all the items is 5 lakh tonnes and the total revenues are 250 crore rupees. What is the ratio of the revenue generated through export of Item 1 per kilogram to the revenue generated through export of Item 4 per kilogram?
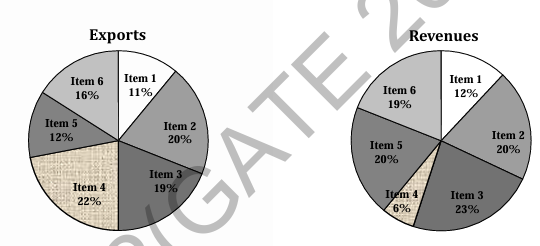
(d) is the correct answer.